

We will begin by briefly examining the history of high stakes tests, the real purpose of high stakes tests, what they really measure and how to more accurately compare US student test scores to scores of kids from other nations.
Our Kids and Our Schools are Not Failing... And Never Have Been!
The first lie used as an excuse for testing kids, firing teachers and closing schools is the ed reformer false claim that “our schools are failing” in comparison to schools in other nations. This claim is not true and never has been true. For more than a century, Americans have been the most productive workers in the world. Because of the innovation of American workers, our economy has been the strongest economy in the world. At the heart of the American economic system has been our public schools - which have consistently produced the most highly trained and creative workforce in the world.
As just one objective example of how our public schools and colleges excel in innovation, compare the number of Nobel Laureates in Science produced by the United States in comparison to other developed countries in the world. The US has as many Nobel Laureates in Science as the next 20 leading countries in the world combined.
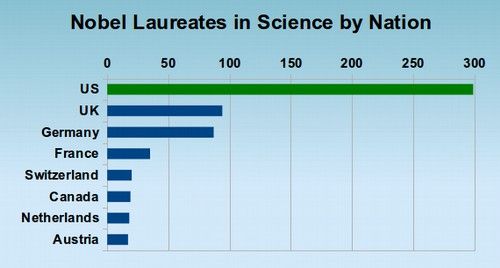
http://en.wikipedia.org/wiki/List_of_countries_by_Nobel_laureates_per_capita
The US Produces More than Enough Highly Trained Workers!
As for the frequently repeated myth that the US does not produce enough computer programmers and engineers, there are more than one million fully qualified computer programmers and engineers in the US who cannot find jobs in the field they were trained for – with more computer programmers and engineers in the US graduating every year and being unable to find jobs in their field. According to the US Census, only one in four STEM graduates has a STEM job. http://www.census.gov/people/io/publications/table_packages.html?eml=gd&utm_medium=email&utm_source=govdelivery
Hal Salzman, professor of public policy at Rutgers University, recently wrote the following in U.S. News and World Report:
"All credible research finds the same evidence about the STEM workforce: ample supply, stagnant wages and, by industry accounts, thousands of applicants for any advertised job. Overall, U.S. colleges produce twice the number of STEM graduates annually as find jobs in those fields...Claiming there is a skills shortage by denying the strength of the U.S. STEM workforce supply is possible only by ignoring the most obvious and direct evidence and obscuring the issue with statistical smokescreens – especially when the Census Bureau reports that only about one in four STEM bachelor’s degree holders has a STEM job, and Microsoft plans to downsize by 18,000 workers over the next year."
http://www.usnews.com/opinion/articles/2014/09/15/stem-graduates-cant-find-jobs

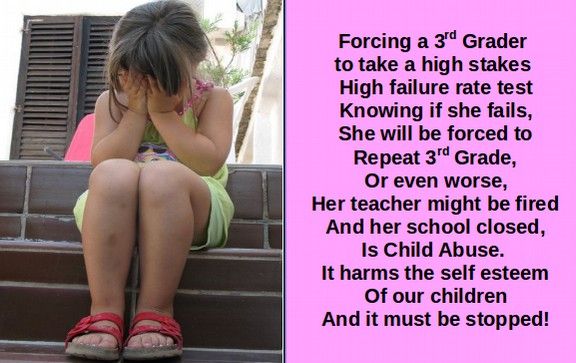
High Stakes, High Failure Rate Tests... The First Weapon of Mass Deception
Sadly, there is a small group of extremely wealthy people who tell us lies like “we Americans are not smart enough” because they want to take over and privatize our public schools. They call themselves “education reformers”. But they are really corporate raiders out to destroy the American system of public schools and replace it with a for-profit system of private schools paid for with hundreds of billions of dollars in tax payers funds. The death of our public schools would not only mean the death of our economy, but the death of our democracy.
High stakes tests are the first and most harmful weapons of mass deception used to destroy and take over schools. Most parents are not aware of how unreliable high stakes tests are. Nor are they aware of how much high stakes tests harm our kids. High stakes tests are based on the simplistic but false assumption that learning can be measured by a number stamped to the foreheads of our children. This magic and extremely deceptive number is then used to unfairly rate children, fire teachers and close schools.
How and when did this insanity of high stakes toxic testing get started? Let's take a journey down memory lane all the way back to 1980.
1980 “Greed is Good” and Public Schools are Bad
Like the decimation of our middle class and the decline of our economy, the destruction of our public schools can be traced back to the election of Ronald Reagan in 1980. In addition to Trickle Down economics, which stole money from the middle class and gave it to the super rich, Reagan promoted the radical ideas of deregulation and allowing the profit motive to over-ride every other factor in the design of our society. In short, he supported the idea that “greed was good.” His plan was to starve all public functions of funding (except the military). But one of the most popular public functions was our public schools. Parents valued their public schools and did not want to see funding for their schools cut. The clever solution of the billionaires who elected Reagan was to reduce the popularity of public schools by claiming that they were failing. This was difficult because our public schools were not failing. Thus, the billionaires made up magic numbers based on misleading high stakes tests in a misleading attempt to fool the public into believing that our schools and kids were failing.
A Nation Deceived
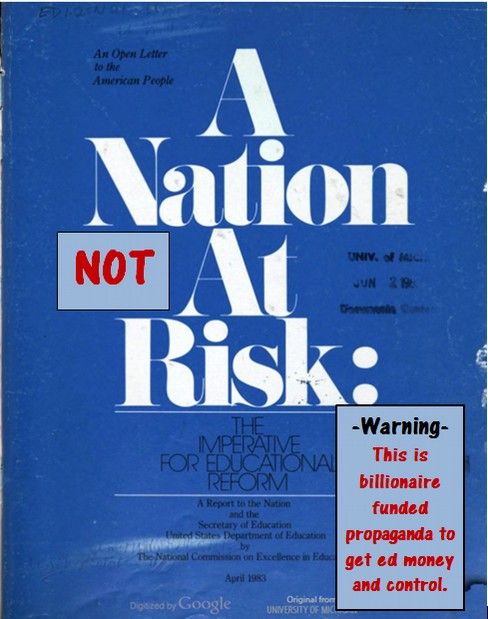
In 1981, Reagan publicly advocated eliminating several sections of the US Government including the Department of Education. As with other Departments he did not like, he appointed opponents of the Departments to run them into the ground. Reagan appointed Terrell Bell to preside over the dismantling of the US Department of Education. In August 1981, Bell appointed David Gardner to head the National Commission on Excellence in Education (NCEE). In 1983, this NCEE commission released a report called A Nation at Risk that falsely claimed that the test scores of US students was far below the test scores of students in other countries. The report began with this false claim:
“Our Nation is at risk. Our once unchallenged preeminence in commerce, industry, science, and technological innovation is being overtaken by competitors throughout the world.”
http://www2.ed.gov/pubs/NatAtRisk/index.html
1983 Our Nation was at Risk... But the danger was not our schools, it was at risk of a takeover of our government by billionaires
The beginning of the corporate education reform movement was the 1983 phony report called A Nation at Risk. This report used high stakes test results to claim that the number on the foreheads of students in the Unites States was lower than the number on the foreheads of students in other countries. This deeply flawed report was used as an excuse to begin the destruction and replacement of our public education system with a billionaire-designed, corporate-run, for-profit education system.
The Nation at Risk report is a very short 30 page document that only takes a few minutes to read. The day after it was released, the corporate controlled media put it on the front page of every newspaper and made it the lead story on every news broadcast in America. During the following 30 days, the Washington Post ran two dozen stories about it. It was a propaganda blitz worthy of Joesph Goebbels. Repeat a lie often enough and everyone will believe it.
Ronald Reagan falsely claimed that the report supported his favorite issue, school prayer in order to whip up religious support for his reelection campaign. Ironically, the report did not even mention school prayer. Nevertheless, Reagan gave 51 speeches on the report and the urgent need for school reform during his 1984 re-election campaign. Remarkably, the Nation At Risk attack on public schools failed to provide any actual evidence, charts, graphs or data to back up its many misleading claims. We will therefore briefly review the overwhelming evidence refuting the claim that our public schools were falling behind schools in other nations.
Evidence Refuting the Claim that US Students Lag Behind Students from Similar Nations
There have been several reviews over the years that have pointed out the problems of the Nation At Risk report. The first of these was a study called the Sandia Report that was commissioned by the Bush White House in 1990. The Sandia Report was supposed to provide evidence supporting the Nation at Risk claims. However, the Sandia Report found that the real evidence did not support the claims in Nation at Risk. The three authors stated: "To our surprise, on nearly every measure, we found steady or slightly improving trends." Instead of American kids doing worse – they were actually doing better!
For example, the Sandia report found that high school completion rates in the US are among the highest in the world and that the reason our test scores were lower on international tests was due to the fact that more poor students took international tests in the US whereas in other countries only the wealthy and top performing students took international tests.
The Bush White House did not want to hear any of this. They therefore threatened the authors and buried the report. The Sandia report was not published until May 1993 after Bush was safely out of office. The citation for this study is: Carson, C.C., Huelskamp, R.M., & Woodall, R.D., (1993, May/June). Perspectives on education in America. Journal of Educational Research, Volume 86, Pages 259-301. This study has been virtually blacklisted. We were not able to find any link to it on the internet. However, we were able to find and read a copy of this study at the Educational Research library at the University of Washington.
In October 1991, the magazine Education Week published an article about the Sandia study and reported that "The researchers who prepared the report could not be reached for comment, and some sources said the researchers had told them that they feared losing their federal funding if they spoke with reporters.
The Sandia researchers "were told it would never see the light of day, that they had better be quiet," one source said. "I fear for their careers." The article went on to add that “American participation in higher education is the highest in the world, and there is no shortage of Americans pursuing technical degrees.”
Miller, Julie A. "Report Questioning 'Crisis' in Education Creates Uproar." Education Week. (9 October 1991): 1, 32. https://readtiger.com/www.edweek.org/ew/articles/1991/10/09/06crisis.h11.html
Another Report Confirmed that American Students are doing better over time rather than worse
In 1994, the Rand Institute did their own review of test scores of US students. They concluded: “This study does not support the view that schools of the 1970s and 1980s have deteriorated in significant ways with respect to the schools of the 1950s and 1960s in their instruction in mathematics and verbal/reading skills. Moreover, it suggests that schools have made significant progress in decreasing inequalities between minority and nonminority students. The scores of non college-bound students have generally risen even more than those of college-bound students.” Rand Institute on Education and Training, Student Achievement and the changing American Family, 1994.
The Problem in the US is Poverty... A disgracefully high child poverty rate in the US is what adversely affects test scores in the US
What the “international comparison” claim ignores is the sad fact that the US is the world leader in child poverty. Only wealthy or high performing students take international tests in other countries whereas nearly all students take international tests in the US. When scores of students at US schools with less than 10% child poverty are compared to other nations which have an average of less than 10% child poverty, US students scored #1 in the world on every area tested by the international PISA test. (Tienken & Orlich, 2013, The School Reform Landscape),
If one compares apples to apples, and controls for poverty, rich students in the US out perform nearly all other rich students in the world, middle income students in the US out perform nearly all other middle income students in the world and lower income students in the US out perform nearly all other lower income students in the world. The only way to further increase US test scores is to reduce the poverty rate which means making sure all parents have full time jobs, all families have stable homes and all children have food to eat, books to read and parks to play in.
Evidence that Child Poverty Affects on Test Scores
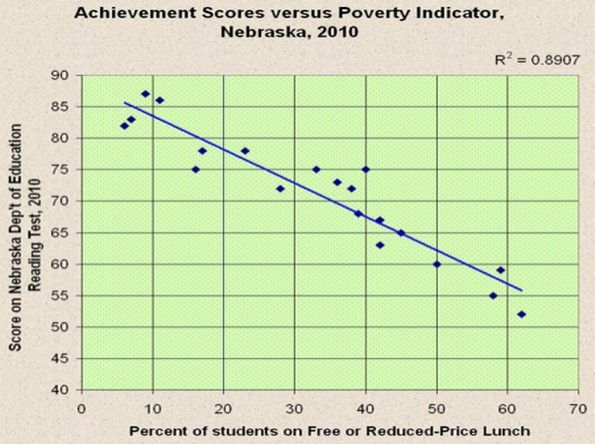
There are hundreds of studies showing a nearly direct relationship between family income and high stakes test scores. Here is a chart showing the correlation between child poverty and child performance at public schools in Nebraska. http://gfbrandenburg.wordpress.com/tag/iva/
(Note: Each diamond below represents a school district in Nebraska. Note that the poorer the students were in a school district, the worse the test scores were in that school district).
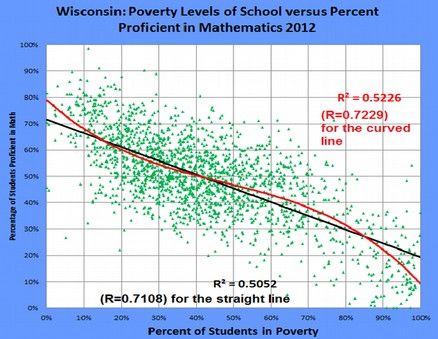
Below is a chart showing essentially the same relationship between poverty and test performance in Wisconsin. This is a chart of schools rather than school districts but the result is the same.
We see the same effect of poverty across all grade levels. Below is a chart comparing the test scores of a low poverty school district (Mercer Island) to a neighboring high poverty school district (Renton). Both school districts are in Washington State and are only a few miles from each other (Source: OSPI Washington State Report Card).
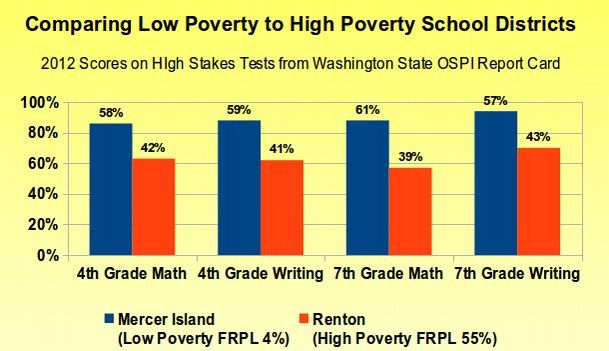
Note that the difference of about 20% in test scores is about half of the difference in poverty rates scores between the school districts. Some low income kids do well. But most low income kids suffer and will continue to suffer until their parents get a job and the children get a stable home.
Failing Students and Failing Schools or Corrupt Leaders and Rigged Economies?
Family income doesn't just determine test scores, it is also the strongest predictor of the dropout rate. Balfanz and Letgers found a strong relationship between poverty and the dropout rate: The higher the percentage of a school’s students living in poverty, the higher the dropout rate. When minority students attend schools in low poverty areas, they graduate at the same rate as white students. Balfanz, Robert & Legters, Nettie, (November, 2004) Locating the Dropout Crisis, John Hopkins University.
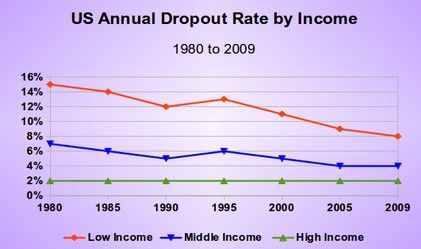
The Four Year Cohort Dropout Rate is about 4 times the US Annual Dropout Rate. Low Income was defined as the bottom 20% of all incomes. High Income was defined as the top 20%. Source: Trends in High School Dropout and Completion Rates in the US 1972 to 2009. US Department of Education
http://files.eric.ed.gov/fulltext/ED524955.pdf
Obviously, the best way to increase the graduation rate in the US would be to make sure all low income parents have full time jobs. Sadly, just the opposite has been happening in the US over the past 14 years. Huge numbers of parents have lost their jobs as money has been gradually transferred from the middle class to the billionaires in the US.
Shamefully High Child Poverty Rates in the United States
Now that we understand the role family income plays in test scores and graduation rates, let's look at the poverty rate in the US over time. Poverty is generally defined in the US as living below the US poverty level which is about $20,000 per year for a family of three. In addition, an equal number of children live in low income families which are defined as being below 185% of the poverty level. In 2007, the poverty rate was 21.5% for individuals who were unemployed, but only 2.5% for individuals who were employed full-time. So child poverty means that their parents do not have a full time job. The decline in full time jobs has gotten much worse since 2000.
Dramatic Rise in High Poverty Schools in the US since 2000
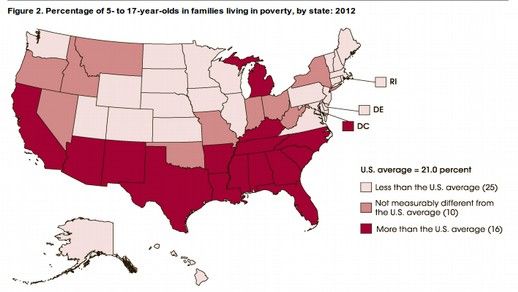
In 2000, only 15% of children in the US were living in poverty. By 2012, the child poverty rate skyrocketed to 21% of school aged children in the US in families living in poverty. Put another way, 11 million of the 50 million children ages 5 to 17 were in families living in poverty. The percentage of school-age children living in poverty varies across the United States from 11 percent in North Dakota to 32 percent in Mississippi.
http://nces.ed.gov/programs/digest/d13/tables/dt13_102.40.asp
The National School Lunch Program is a federally assisted meal program. To be eligible for free or reduced lunch (FRPL), a student must be from a low income household with an income at or below 185 percent of the poverty threshold. In nearly all cases, child poverty is caused by parental job loss or moving from a high paying full time job to a low paying part time job. While national statistics are a bit lacking, we know that the free and reduced lunch students are rising rapidly. In 2006, the national rate for FRPL was 42%. In 2009, the FRPL rate was 45% and in 2012 (the latest information available) it was 48%. In addition, the percent of high poverty schools was much higher in 2012 than it was in 2000.
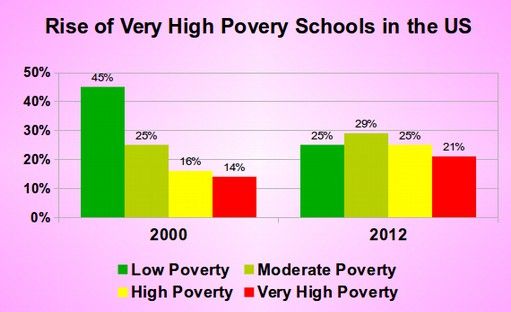
A low poverty school has 25% or less of students eligible for Free or Reduced Price Lunch (FRPL). A moderate poverty school has 26% to 50% of students eligible for FRPL. A high poverty school has 51% to 75% of students eligible for FRPL. A very high poverty school has more than 75% of students eligible for FRPL.
What is shocking about the above chart is that just 14 years ago, almost half of all public schools in the US were low poverty schools – with only 30% being High to Very High poverty schools. Today, only one in four schools are low poverty schools while the percent of high to very high poverty schools has skyrocketed to 46%. SOURCE: U.S. Department of Education, National Center for Education Statistics, Common Core of Data (CCD), “Public Elementary/Secondary School Universe Survey,” 1999–2000 and 2011–12. See Digest of Education Statistics 2013, table 216.30.
We have more detailed information for the past 16 years for the State of Washington. The rise in childhood poverty in the US is mirrored in the State of Washington. In 2000, only 30% of the students were eligible for Free or Reduced Price Lunch. Today, almost 50% of all students in Washington State qualify for FRPL.
Below is the rate for the past 16 years that OSPI has been posting this statistic as part of the OSPI Washington State Report Card. http://reportcard.ospi.k12.wa.us/summary.aspx?year=2012-13
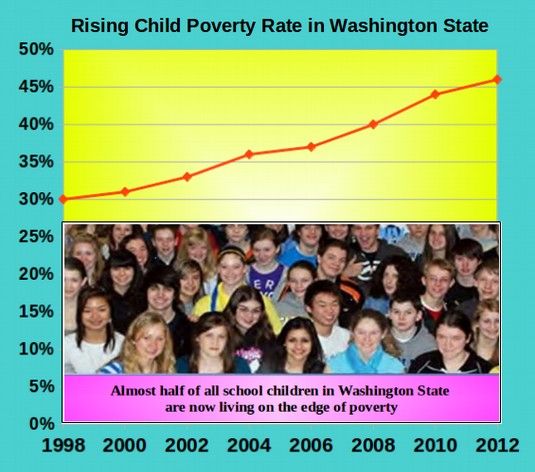
The child poverty rate in Washington State is currently at a shocking 46%. How can this be? There are two components to this problem. First, Washington State has a total population of about 7 million people. Of these about 1 million are school age children and about 4 million are adults in the workforce. Unfortunately, Washington only has about 3 million jobs. This means the real unemployment rate in Washington State is about 25% - not 6% as reported in the billionaire controlled media. In addition, of the 3 million jobs, about one million jobs have been cut from full time to part time jobs – which are cheaper for wealthy corporations as part time jobs do not require paying for health care and other benefits. The average family has one child. So one in four children live in extreme poverty because their parents do not have a job. Another one in four children live in borderline poverty because their parents only have part time jobs.
Thanks to billionaires corrupting our political system, deregulating the banks and crashing our economy, nearly half of the children in our State and in our naton are now living in or near poverty. Just 14 years ago, when OSPI first began posting this statistic, the percent of children who qualified for free or reduced price lunch was “only” 30%. Child poverty in turn is the leading cause of school failure. If we want kids to do better in school, it is time to make sure that their parents have a living wage full time job!
Comparing the Poverty Rate in the US to other Developed Countries
Due to the different values of different currencies and the difference in cost of living in different countries, there are many different ways to determine child poverty. But regardless of the method used, the United States comes in near the worst of all developed countries in the world in terms of child poverty.
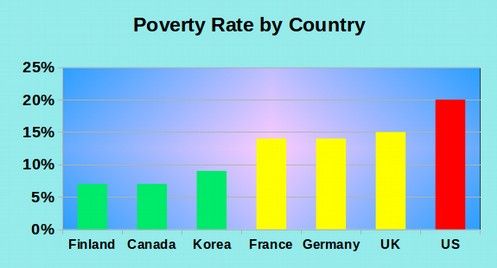
Because the official policy in the US since 1980 has been to focus on deregulation and “drill and kill” testing, rather than creating good paying jobs to reduce poverty, the poverty rate in the US is increasing faster in the US than in any developed country in the world. In November 2012, the US Census Bureau said more than 20% of American children lived in poverty up from 18% in 2009. Meanwhile, the poverty rate in so-called “socialist” countries like Finland is only 7%. This is a major reason students in Finland do so well in school. It is because their parents are also doing well at home.
https://en.wikipedia.org/wiki/Poverty_in_the_United_States#cite_note-Census:_U.S._Poverty_Rate_Spikes.2C_Nearly_50_Million_Americans_Affected-7
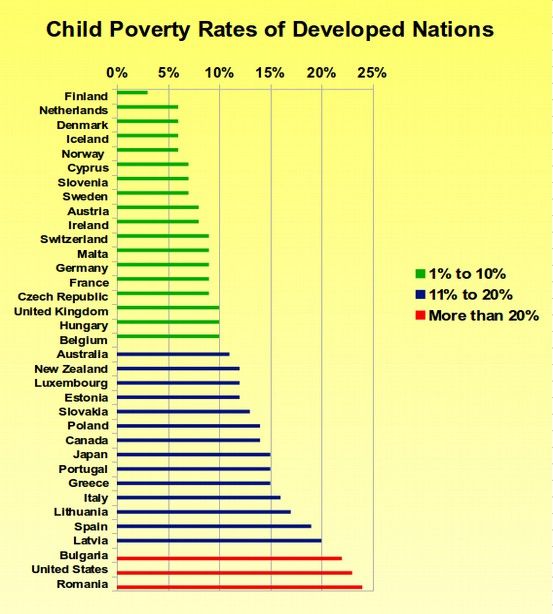
The National Center for Child Poverty concluded that the child poverty rate in the US is even higher putting it at 22% in 2010 and 24% in 2012. http://www.nccp.org/
A 2013 UNICEF report ranked the U.S. as having the second highest relative child poverty rates in the developed world. UNICEF defines childhood poverty as living in a household where the family income is half of the national median income. Since the median income in the US is about $50,000 per year, this would mean a US household surviving on less than $25,000 per year. Below is the 2013 UNICEF childhood poverty rates of the world's richest countries. Using this measure, 23% of the children in the US are living in poverty. http://www.unicef-irc.org/publications/pdf/rc11_eng.pdf
Why does the US have among the highest poverty rates in the world? Could it be because we spend more on wars and military than all other nations in the world combined? Could it be that we have unfair trade agreements that allow for the outsourcing of millions of jobs? Or is it because we simply have the most billionaires in the world? Or is it that we have the most corrupt political system in the world – one where billionaires are allowed to buy elections and bribe politicians who then give billions of dollars in tax breaks to the super rich who elected them?
How are US kids doing compared to other countries when controlled for poverty?
Now that we know where the US stands in the developed world in terms of poverty, let's see how this poverty rate affects our students scores on international tests. US Education Secretary Arne Duncan has been the lead spokesperson for the Billionaire Corporate Raiders in their attempt to destroy and take over our public schools. Arne's claim to fame was his destruction of Chicago Public Schools before being given the job of destroying public schools all across the nation. He is the inventor and promoter of a $4.5 billion snake oil scam called Race To The Top. We will cover more of Arne's scams in the chapters on Common Core and Charter Schools. Here is one of Arne's most recent false statements: “Even with the modest increases in math and reading performance on the 2013 NAEP, US students are still well behind their peers in top-performing countries.”
What Arne conveniently ignores is that the US has one of the highest poverty rates of any developed nation. When one adjusts for child poverty, the US is about even in most areas to other similar nations and is ahead of other countries in many areas. For example, despite the huge burden of poverty, even when not adjusted for child poverty, US students substantially outperform Finnish students in algebra.
http://www.epi.org/publication/us-student-performance-testing/
This is remarkable as Finland has a child poverty rate that is one third of the poverty rate in the US. Finish students also get more experienced teachers and smaller class sizes than our students have in the US. In addition, all Finnish students receive three years of free preschool. They therefore have three more years of schooling than US students for any given grade. Far from failing, US public schools are doing a remarkable job of preparing students compared to other nations. When Arne Duncan says our schools are failing our kids, he is simply wrong. It is Arne Duncan who is failing our kids by refusing to even discuss the issues of childhood poverty and skyrocketing class sizes.
To justify their campaign, ed reformers like Arne Duncan repeat, over and over again, that U.S. students are trailing far behind their peers in other nations, that U.S. public schools are failing. The claims are false. Two of the three major international tests—the Progress in International Reading Literacy Study and the Trends in International Math and Science Study—break down student scores according to the poverty rate in each school. The tests are given every five years. The most recent results (2006) showed that students in U.S. schools where the poverty rate was less than 10 percent ranked first in the world in reading, first in science, and third in math.

When the poverty rate was 10 percent to 25 percent, U.S. students still ranked first in reading and science. But as the poverty rate rose still higher, students ranked lower and lower.
Below is a chart showing international math test results for two states in the US where they are known – Massachusetts and Florida. Massachusetts has a poverty rate below the US average at 15% while Florida has a child poverty rate above the US average at 25%. Take a close look at how each State would rank in the developed world if they were an independent nation. Massachusetts has international math scores near the highest in the developed world while Florida has among the lowest math scores in the developed world. The reason Florida is doing much worse than the rest of the nation is that it has been subjected to toxic testing and other billionaire Ed Reform scams for a longer period of time.
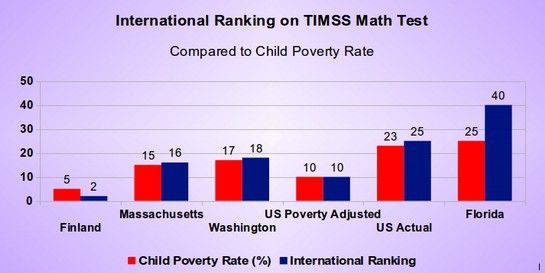
Sources: Child Poverty Rate from
http://nces.ed.gov/programs/digest/d13/tables/dt13_102.40.asp
International Test comparisons
http://phys.org/news/2013-01-poor-international-student.html
How are US Kids Really Doing Compared to Other Nations?
In 2013, Martin Carnoy with the Stanford Graduate School of Education and Richard Rothstein with the Economic Policy Institute produced a highly detailed study breaking down how different income levels of students would perform in the United States on various international tests. Here is the citation and link to this important 99 page study: Carnoy, Martin & Rothstein, Richard (January 2013) What Do International Tests Really Show About U.S. Student Performance? Economic Policy Institute, Washington DC. http://s2.epi.org/files/2013/EPI-What-do-international-tests-really-show-about-US-student-performance.pdf
The authors provided extensive data confirming that “If U.S. adolescents had a social class distribution that was similar to the distribution in countries to which the United States is frequently compared, average reading scores in the United States would be higher than average reading scores in the similar post-industrial countries we examined (France, Germany, and the United Kingdom), and average math scores in the United States would be about the same as average math scores in similar post-industrial countries... This re-estimate would improve the U.S. place in the international ranking of all OECD countries, bringing the U.S. average score to sixth in reading and 13th in math.”
One country that is doing much better than the US and everyone else, even one segregated by family income status is Finland. The authors state: “Great policy attention in recent years has been focused on the high average performance of adolescents in Finland. This attention may be justified, because both math and reading scores in Finland are higher for every social class group than in the United States.”
Many have concluded that Finland must have better schools than the US. But it could also be that Finland has almost no child poverty and this has resulted in better scores on international tests. Finland takes better care of kids. Whatever it is, we should try to be more like Finland.
The authors pointed out some of the advantages of low poverty noting, “Children whose parents read to them at home, whose health is good and can attend school regularly, who do not live in fear of crime and violence, who enjoy stable housing and continuous school attendance, whose parents’ regular employment creates security, who are exposed to museums, libraries, music and art lessons, who travel outside their immediate neighborhoods, and who are surrounded by adults who model high educational achievement and attainment will, on average, achieve at higher levels than children without these educationally relevant advantages.”
The authors also compared two low poverty States in the US, Massachusetts and Minnesota, to three other similar countries, these being the UK, France and Germany. The authors concluded: “Massachusetts and Minnesota outperform the three similar post-industrial countries, in some comparisons substantially.” Nevertheless, under the insane standard of “No Child Left Behind,” every public school in Massachusetts and Minnesota (and every other State in the US) are now considered “failing” schools!
The problem is not public schools in the United States or public school teachers in the United States or public school students in the United States; it is childhood poverty in the United States. If we could only get billionaire tax evaders to pay their fair share of State and federal taxes, we could hire more people to be teachers and build schools and roads which would greatly reduce poverty and thereby increase the achievement levels of all students in the United States.
The PISA International Test was Deliberately Rigged in 2009 to Reduce the Scores of US Students
In analyzing the percentage of various income groups of US students taking an international math and reading high stakes test called the PISA test in 2009, the authors found a rather suspicious “sampling error.” The authors stated:
“Forty percent of the PISA sample was drawn from schools where half or more of the students were eligible for free or reduced-price lunches. Only 32 percent of all U.S. students attended such schools in 2009–2010 when the PISA test was given. Sixteen percent of the PISA sample was drawn from schools where more than 75 percent of students are FRPL-eligible, yet fewer than half as many, 6 percent of U.S. high school students, actually attend schools that are so seriously impacted by concentrated poverty. Likewise, students who attend schools where few students are FRPL-eligible, and whose scores tend, on average, to be higher, were undersampled. This oversampling of students who attend schools with high levels of poverty and undersampling of students from schools with less poverty results in artificially low PISA reports of national average scores.”
Put another way, the US Department of Education used a sample of very low income schools that they knew would get lower test scores in an obvious attempt to rig the results so that they could report that US schools were doing worse than schools in other nations. All other nations submitted a more accurate sample of their student population. A few even used a sample of higher income students by having lower performing students not take the test.
Why would Arne Duncan and his Department of Education rig the PISA test scores? Because their real goal is not to help our kids but to destroy our schools so that they can reap billions in profits from privatizing schools.
More Evidence of the Link Between Family Income and Test Scores
In addition to using misleading data on international test scores, the Nation at Risk reported used misleading data on a US College Entrance Exam called the SAT test.
Another Nation At Risk False Claim: The College Board's Scholastic Aptitude Tests (SAT) demonstrate a virtually unbroken decline from 1963 to 1980. Average verbal scores fell over 50 points and average mathematics scores dropped nearly 40 points.
Once again, the Nation at Risk authors deliberately ignored the known link between family income and test scores in order to deceive the American people into believing that schools in the US were getting worse. The SAT test is a very poor test that has never been shown to be related to college achievement or any other factor other than parental income. Nevertheless, the reason the SAT scores fell from 1963 to 1980 was due almost entirely to the fact that many more poor and middle class students took the test in 1980 than took the test in 1963. Because SAT test scores are directly related to family income, the scores in any given year are also directly related to the family income of those who took the test that year.
A better way to judge the performance of schools would be to compare test takers of the past and present who were alike in class ranking. This is what researchers at the Sandia Laboratories did (Carson and others 1993). They selected a group of students from the 1990 SAT test takers who matched in gender and class ranking those students who took the test in 1975. When the researchers compared the two groups' average scores, the 1990 group outscored the 1975 group by 30 points.
Here we will cite an important study done by my former advisor at Washington State University, Dr. Donald Orlich. Professor Orlich has been providing research on this issue ever since I was an undergraduate – more than 30 years ago. He was right 30 years ago and he is even more right today. Here is the citation and link for his 2006 study: Test Scores, Poverty and Ethnicity, Orlich, Donald C. And Gifford, Glenn. WSU Summit on Public Education (2006) http://www.cha.wa.gov/?q=files/Highstakestesting_poverty_ethnicity.pdf
Dr. Orlich states: “For the SAT, 97% of the variance (r 2 = .97) in test scores may be explained by family income of the test takers.”
Let's put this sentence in plain English. Variance or the correlation between one variable and another can run from 0% - which means a random or no relationship to 100% which means a direct one to one relationship. Due to the huge variation of children, there is almost nothing in child development research than has a variance of more than 50%. So an explained variance of 97% means that the only factor that influences SAT test scores is the family income of the test taker.
Here is a graph from Dr. Orlich's study:
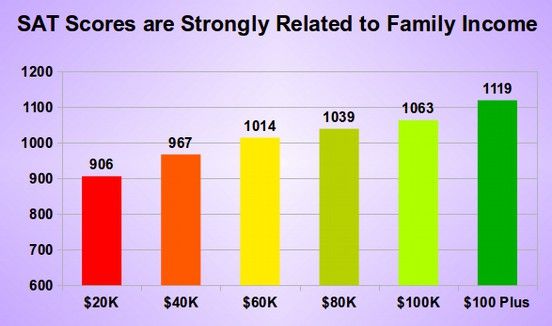
For students coming from families with an income of less than $20,000, the median score was about 900. For students coming from a median income family of under $40,000, the median total SAT score was under 1000. For students coming from extremely wealthy families, the median score was more than 1100. So imagine a college with a minimum SAT cutoff score of 1100. Nearly all of the applicants who qualify will come from very wealthy families. These are also the only families who can afford the skyrocketing college tuition rates.
SOURCE: College Board, College-Bound Seniors 2005: A Profile of SAT Program Test Takers. Data used with permission of the Fair Test Examiner. Retrieved from http://www.fairtest.org/nattest/SAT%20
Scoresn%202004%20Chart.pdf.
The truth is that SAT scores – or any high stakes test scores – do not accurately measure what children know. Instead, they merely measure the wealth of a child's parents. But if one did want to raise scores on high stakes tests, the best way to do it would be to give the parents of low income children better jobs, give the family a home and give the children some food and a safe, local park to play in. The one real benefit of high stakes tests is that they create billions of dollars in profits for the scam artists that promote them. In the 1990s' these scam artists used the fake Nation at Risk report to create a multibillion dollar industry. We will therefore next look at the Rise of the Toxic Test Scammers.